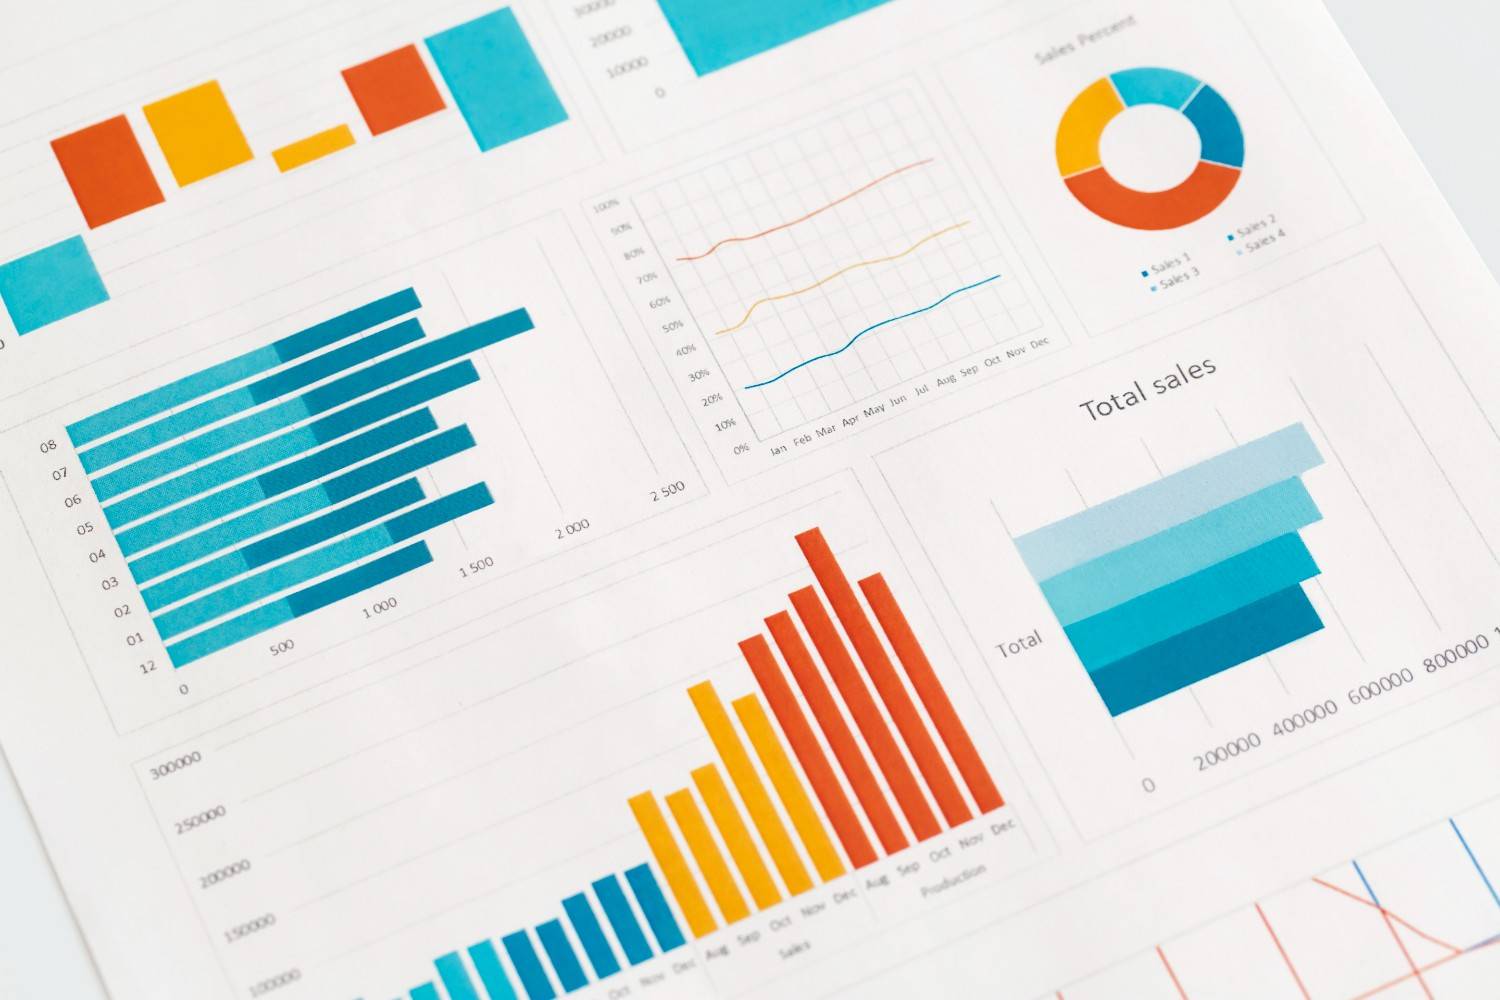
The Data & Analytics track gives you practical skills to work confidently with data—even if you’re not a data analyst. You’ll learn how to clean, interpret, and visualize data using accessible tools like Google Sheets, SQL, and Looker Studio.
Whether you’re building reports for work, launching your own business, or improving decision-making, this track helps you turn messy data into clear insights.
Not at all. This track focuses on practical tools and concepts—no complex math or statistics required.
Yes. Each module includes real projects, and you’ll leave with a complete set of dashboards and templates.
We cover SQL from the ground up. No prior experience is needed, and you’ll start with easy queries and build confidence quickly.
Many lessons will work in Excel too, but we focus on Sheets for accessibility and integration with Looker Studio.
Definitely. Data literacy is valuable across industries—from marketing to operations to finance—and can be a major professional advantage.
Yes. All lessons include downloadable spreadsheets and datasets so you can follow along and build your own versions.

$89.00
Empowering learners with practical, career-focused online courses in AI, data, coding, and digital tools. Learn at your pace—no fluff, just skills that matter.
Copyright © 2025 Master Tech Skills. All rights reserved.